Price action trading - Long body candle reversal

Salah satu sinyal buy/sell berdasarkan price action yang cukup berhasil adalah dengan memanfaatkan long body candle reversal (istilah saya sendiri, gak tau istilah keren nya apa hehe...). Ciri dari sinyal Long body candle reversal ini adalah apabila ada satu candle panjang misalnya bullish kemudian candle berikutnya adalah candle bearish dengan panjang melebihi/menembus candle bullish tersebut maka kita bisa ambil posisi sell dan target profit sebesar panjang dari candle bullish tersebut. Berikut illustrasinya

Successful Candlestick formation #1

Hi, its been a while since the last post. I am a bit busy with another kind of job so I cannot post more about my trading experiences. Here, I want to add my trading arsenal with the price action strategy. As always, I do not believe in most fancy indicators. Price actions is the one and only strategy which gives me more profits each days. Here I want to show you a nice price action setup which you may read already on another blogs or someone else's website. 

I do not know the name of this candlestick formation. Name is not too important for me :) 

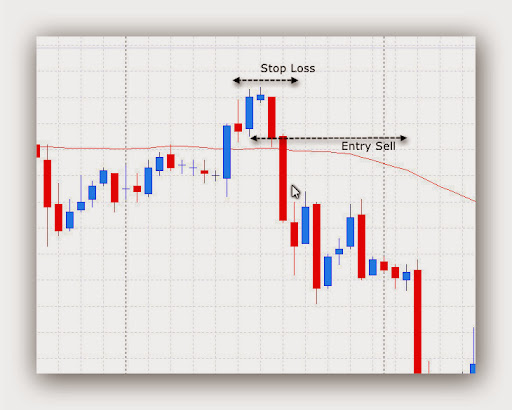
OK, I'll try to explain the chart above. 

See the tiny candle on the peak of the chart. after a quite long bullish candle then the next candle is very tiny/small with short tail on each side. This candle formation will be a good short setup only when it breaks the previous longer bullish candle. See the entry line above. I open sell only when it break the longer bullish candle not the small candle. Stop Loss always put few pips above the highest point on the candle formation. 

Another successive Fibonacci breakout

I was not take this trade because I do not monitor the Forex chart whole day. It was Friday, November 8th 2013. EURJPY has made significant down trend in last few days. I spot this trade setup but it was too late. I just want to show how Fibonacci breakout could be profitable at that time. 
See how I draw the fibonacci. I could not explain in words I hope the picture above can explain better. The key is to always spot the most recent support and resistant, the place where price bounce. This is the key!.
On the chart above, we can get 50 pips in just few hours before the market closed.

Trading tanpa emosi dengan Fibonacci breakout

Hello traders, seperti biasa saya akan menuliskan pengalaman saya menggunakan metode yang selama ini cukup efektif untuk saya yaitu Fibonacci breakout. Kadangkala, yang membuat kita loss dalam trading itu disebabkan oleh emosi kita yang tidak bisa kita kendalikan. Kita cut loss karena kita pikir harga akan bergerak berlawanan dengan analisa kita. 
Kali ini akan saya coba contohkan bagaimana trading tanpa emosi dengan Fibonacci breakout ini. Dengan menggunakan Fibonacci breakout strategy ini, kita tidak perlu menganalisa atau memprediksi harga akan bergerak kemana. Kita tinggal ikuti saja sinyal yang diberikan oleh Fibonacci breakout, taruh TP. Anda juga bisa menaruh SL apabila anda mau. Saya pribadi jarang menggunakan SL. 
Baik, perhatikan contoh berikut ini. Contoh-contoh seperti ini sudah sering saya tulis di posting saya sebelumnya. 

Fibonacci breakout pattern - 2 candle berurutan

Dalam kesempatan ini akan saya coba tuliskan pola/pattern yang cukup bagus untuk teknik fibonacci breakout. Pada posting sebelumnya sudah saya jelaskan pola bearish candle berurutan dan bullish candle berurutan. Namun, kadang kita menunggu terlalu lama dan tangan ini gatal ingin open posisi. Tidak masalah, sekarang saya coba jelaskan cara lain yang sebenarnya adalah peningkatan dari kedua teknik diatas. 
Syarat utama adalah, harga sudah membentuk 2 kali swing. Baik itu membentuk higher high ataupun lower high. 
1. Pola 2 candle bullish berurutan. 
Pola ini pada dasarnya adalah mengamati dan menunggu reversal dari 2 buah candle bullish yang berurutan. Dalam artian, kita harus memiliki 2 buah candle bullish di titik tertinggi. Misalnya seperti ini. Dalam contoh ini saya gunakan GBPUSD timeframe H1. 

Fibonacci Breakout pattern - Consecutive bearish candles

Pada penjelasan pola fibonacci breakout sebelumnya, sudah saya jelaskan mengenai pola candle panjang. Sekarang, saatnya pola yang kedua yang cukup ampuh yaitu pola consecutive bearish candles. Kalau dalam bahasa indonesia kurang lebih maksudnya adalah pola candle turun yang berurutan (aneh banget hehe). Lihat gambar ini:

Fibonacci Breakout strategy - Pola candle panjang

Ini merupakan catatan pribadi saya untuk mendalami dunia Forex Trading. Karena Fibonacci Breakout merupakan andalan saya, saya terus mencoba mencari celah dengan mempelajari pola-pola candlestick yang bagus untuk menerapkan teknik Fibonacci Breakout ini. Ada beragam pola candle yang bagus untuk dijadikan acuan penggunaan Fibonacci Breakout ini. Salah satunya adalah setelah adanya candle bullish atau bearish yang cukup panjang. 

Trade result BUY EURJPY 29 October 2013

If you follow my last trade signal BUY EURJPY on 29 October 2013, you should running in profit by now because currently EURJPY is moving around 134.89. 5 more pips and our take profit will be hit.
I've closed my transaction in profit. Still unsure with the upcoming USD fundamental news.

Trade signal - Buy EURJPY on 29 October 2013

I just opened a long position on EURJPY pair, today 29th October 2013. This trade was taken based on a Fibonacci breakout on M15 time frame. The price has triggered the Long position but still not reached its target 161.8 of the fibonacce level. Here is the screenshot
Trade details:
  • Pair: EURJPY
  • Direction: Long/Buy
  • Price: 134.72
  • Target: 134.92
  • Size: 0.2 lot
Hope this position will hit the target by this afternoon will be good. 

Fibonacci breakout model

Dalam menggunakan teknik fibonacci breakout ini sebenarnya ada beberapa variasi yang bisa kita gunakan sebagai acuan untuk open posisi. Kunci dari teknik ini adalah cara menggambar atau posisi kita menggambar fibonacci. Kalau salah, bisa fatal akibatnya, yaitu floating yang terlalu besar. Dalam artikel ini saya akan coba gambarkan kondisi-kondisi yang bisa kita jadikan acuan untuk menggambar fibonacci dan sebagai dasar kita melakukan open posisi. 
Model 1. Harga membentuk higher high (SELL Signal)
Model 1

Sinyal untuk posisi BUY dengan teknik Fibonacci breakout

Setelah dalam posting sebelum nya saya jelaskan kondisi yang bagus untuk open posisi SELL dengan metode Fibonacci breakout, sekarang akan saya coba jelaskan kondisi yang ideal untuk open posisi BUY dengan teknik yang sama. Dasar dari teknik ini adalah ketika harga menembus resisten maka harga akan di teruskan ke atas.
Syarat nya adalah:
  • Harga sudah membentul lower low. Jadi sudah terbentuk 2 dasar (bottom) yang lebih rendah. 
  • Posisi 2 dasar ini berada di Bollinger Bands bawah. Atau paling tidak salah satu low ini sudah menyentuh Bollinger Bands bawah. Sejauh pengamatan saya, ada banyak kondisi yang membentuk 2 dasar tapi tidak menyentuh Bollinger Bands bawah hasilnya kurang bagus. 
Lihat gambar ini

Kondisi ideal untuk Sell dengan metode fibonacci breakout

Pada posting berikut akan saya coba jelaskan salah satu kondisi ideal untuk posisi SELL dengan metode Fibonacci breakout yang cukup sukses saya gunakan beberapa waktu terakhir. Syarat utama untuk open posisi SELL adalah candle membentuk higher high. Lihat gambar berikut:

Got 30 pips on GBPJPY 25 October 2013

Fibonacci breakout strikes again. I just got 30 pips on GBPJPY 25 October 2013. I short GBPJPY when the price broke my fibonacci level 100. Here is the illustration:
Actually, the price did not hit the target (fibo level 161.8) yet. And currently, when I wrote this post, the price move up little bit (M15 time frame). I hope I can continue to sell again in next few candles until it hits the Fibonacci level 161.8. 
I am currently trying to find a quick way to share this kind of signal to my blog's readers. Do you have any suggestion to share the signal in very quick mode? 

Just got 15 pips on EURUSD 24 October 2013

Fibonacci breakout still my favorite. Just now, I got 15 pips on EURUSD pair. I opened BUY order after the price break the 100 fibonacci level and as always, 161.8 fibonacci level is my target. Its good enough.
How can I open BUY position? Here is the answer:
On the chart above (EURUSD M15), the price has made a new high and then it move lower and create a new lower high. This new lower high is our trigger to open the trade. The next few candles, the price break the recent high and I open BUY position. My target is the 161.8 level of Fibonacci.
I hope the chart above explain better than my words. :)

Fibonacci breakout still the best trade system so far

I do love this system which called Fibonacci breakout system. The basic of this system is to catch the breakout on 100 fibonacci level and the target is 161.8 fibonacci level. Fibonacci breakout system works on any pairs and best on M15 or higher timeframe. But I do not recommend to use this system on D1 or weekly time frame since it will take longer and need more balance to hold the floating. 
See the example on EURUSD H4 below
In order to open BUY, price have to make lower high. If this condition does not meet, we do not open buy. See the picture above where EURUSD has made lower high. The idea is to open the BUY position once price break the last lower high. Sometimes price directly move up without any retest, but sometime price still made retest. 

Powerful Grid based Expert Advisor

I am currently testing this Expert Advisor on my trading platform MT4. This grid based EA seems to be a powerful one. Its not an ordinary grid based expert advisor that commonly using martingale model. On a backtest, it can gives more than 50 % return in a month with a very small lot and small drawdown. The picture below is the backtest screenshot using the following details:
  • Initial balance : 100 USD
  • Initial lots : 0.1
  • Maximal lots: 1
  • Level : 5
And the result from 1 September 2013 to 15 October 2013 is:

Please leave me your comment if you want to try this EA. Its free..

Trading signal 2 October 2013

Here I want to share a free trading signal for today 2 October 2013. This trade is based on Fibonacci breakout. Open trade when the price hit the following price or simply put a pending order using the following trade details:

  • Currency: EURJPY
  • Position: BUY Stop
  • Price: 132.87
  • Take Profit: 133.12

trade signal 2 oct 2013


Almost Perfect Fibonacci breakout strategy

I’ve been testing this kind of trading strategy for about 3 months in both real and demo account. The main problem of this strategy is to believe this strategy itself. With fibonacci, if all conditions are satisfied, 99% the target will be reach. This strategy works on any time frame but its recommended to use H1 or H4 only since these TF have less fakeout and why I am not recommend to use D1 or higher since its too long to wait for the trade setup and target to be reached.

The main conditions must be met are:

  1. Price has made higher high on SELL signal and lower low for BUY signal. This Fibonacci breakout is a reversal strategy. So actually we buy at a low price and SELL at high price.
  2. Do not use stop loss. Just use your lot management based on your account balance. Its recommend to have 1000 or 2000 USD for 1 mini lot per trade. So if you only have 100 USD on your account, you should use 0.1 mini lot on each trade.
  3. Price must break out breakout line which is 100 fibo level. Do not open any trade if the price does not break this line.

Ideal BUY position

First, find and identify the most recent lower low. Make sure price has made a significant lower low. Then, when price move up and break the most recent high, it will reach the Fibo level 161.8. See my illustration below

fibo breakout 1


Just got 10 pips on EURJPY 26 September 2013

I just opened buy trade on EURJPY this morning and alhamdulillah I got 10 pips in just few minutes. This is a fibonacci breakout strategy which gives me a lot of pips so far. Here is the trade screenshot.

buy-eurjpy-fibo


Fibonacci breakout trade AUDUSD 13 September 2013

Fibonacci breakout still my favorite system right now. On this post I want to show you how this system works pretty well on AUDUSD 13 September 2013 on M15 time frame. In order to open BUY position, I have to wait the price made a fresh lower low. If this condition does not met, I do not enter the trade. See the setup below

fibo breakout


Trade signal SELL EURJPY on 11 September 2013

Here is my trade signal for today 11 September 2013. I was waiting for Short position on EURJPY or USDJPY. Here is my trade setup

eurjpy-sell

Position details:

  • Direction: Short/SELL
  • Pair: EURJPY
  • Price: 132.96
  • Take Profit: 132.63
  • Size: 1 lot
  • SL: No SL

We’ll see in the next few hours

Trendline breakout with Fibonacci

This post will show you how to trade using trendline breakout method and Fibonacci level as the target or take profit area. On this example I am going to show you how this system works for you. No indicator needed. We only watch for the significant swing highs and swing lows.

trendline-fibonacci


Short GBPJPY 8 September 2013

I just open short position on GBPJPY pair on 8 September 2013. This trade is based on Fibonacci breakout system. I only look for about 15 pips as my target but I use 5 mini lots. I hope this will be a good trade for today.

gbpjpy-8-sept-2013


Buy EURJPY on Monday 02 September 2013

This is a free Forex signal from my self and I hope this will profitable and hit my profit target. EURJPY has broken my resistant area and now moving upward. The target will be the 161.8 level of the Fibonacci retracement. I called this strategy as Fibonacci breakout trading system. Here is the setup:

fibo breakout

The price has move up and break the 100 level of Fibonacci. I open Long and put the target on 161.8 level. This could be a semi long trading since I am sure that my take profit will not hit in the next few hours.

Lets wait and see.

Price action trading with Donchian Bands

Personally,I am still have no confidence to trade price action only. I still need a dynamic support and resistant indicator to improve my confidence when entering the trade. One of the good tool that I found is the Donchian Bands or Donchian Channel. I use Donchian Bands as the bounce area when price hit the upper or lower bands and there is a price action signal around the area.

After backtesting and looking for the good signal, the following trade conditions are good area to open the trade

BUY Position

  • Candle must hit or move around lower Donchian Bands
  • Candle must be closed and have a long wick—pin bar candle is more powerful
  • Open position when price move up and break the long wick candle
  • I use fibonacci 161 level for my target
  • Stop loss must be placed on the recent low on the lower Donchian Bands

Illustration

pin bar donchian


Pin bar trading EURJPY 17 July 2013

In term of learning Forex, I use Trade Sim expert advisor to improve my sense of detecting candle stick pattern trading. Here I want to show you how the pin bar candle works perfectly. I use EURJPY on 17 July 2013 as the base. See the chart below for better visualization.

pinbar


Failed long wick signal

On my previous post, I’ve shown a successful long wick trading signal. Here I am going to show you how the long wick signal can be failed as well as any other signal. Since there is no such a perfect system, stop loss always the savior for every trading setup.

failed long wick


Price action trading using long wick candle signal

I like to trade based on price action with no indicator attached on my chart. I don’t like any indicators on my chart because it makes me confuse sometimes. Now, I am learning to trade based on price action only. And the most price action signal that I love is the long wick/tail candle.

How to trade this long tailed candle?

long wick


Simple price action trading strategy-pin bar candlestick

In last couple days I searched for any new profitable Forex method without any indicator. I started with Fibonacci breakout and it works pretty well. Now, I am trying to combine the Fibonacci breakout and some other price action strategy. Price action is a good way to trade Forex currencies because if we rely on indicators, we will missed the momentum.

On this post, I am going to show some nice setup using pin bar candlestick or hammer type candlestick. I do not trade based on this pin bar only but, if we spot a pin bar candle, we can prepare ourselves to enter the trade as well.

Breakout trading on Gold 13 Aug 2013

I just open Long position on Gold. This position is based on my trendline breakout.

buy-gold-1

Gold has just broke the trendline and latest resistant area. I hope this breakout is valid and can hit my Take Profit area.

Here is my trade:

  • Position: BUY/Long
  • Lot: 0.2
  • Price: 1336.57
  • TP: 1339.0
  • SL: 1333.42

Will see on the next few hours.

Catch the breakout earlier on lower time frame

In many cases, for example if we use M15 as our base for breakout trading, we can only get few pips and then the price already reverse against us. To avoid this, we can use lower time frame to catch the breakout earlier. See example below

M15 time frame trade setup

m15 breakout


10 pips strategy based on breakout

Hi, see you again in this blog. Here I want to share how to get 10 pips per trade with trendline breakout. Its a simple strategy without any indicator. You only need to learn how to draw trendline connecting supports or resistant. This strategy applies to any pairs and any time frame but I recommend to use M15 because we only want to get 10 pips .

SELL condition

10pips strategy-1


How to trade trendline breakout without any indicator

Believe or not, any indicators are based on price. So, they will be always late and formed after the price. Personally, I don't like fancy indicators. MT4 application already equipped with many powerful indicators such as Bollinger Bands, CCI and Stochastic. I think with those indi, you can be successfully in trading. The key is risk management.

Here I want to show you how to trade without many confusing indicators. We will try to trade based on price action only with trendline. As long as I learn Forex, trendline breakout give me better result than any other strategy. Indicators such as Stochastic, CCI and MACD are helpful when there is divergence.

SELL signal on AUDUSD 8 August 2013

Its currently 9.30 PM on my time zone and today AUDUSD has made a pretty nice up trend. My previous SELL signal on AUDUSD hit my stop loss at -50 pips. I loss 50 dollar today but its fine. Now I am preparing a SELL position on AUDUSD. Wait until the price break the trend line and I think it safe to get 20 pips down ward.

audusd sell

Here is my trade setup

  • Pair: AUDUSD
  • Timeframe: M15
  • Position: SELL stop
  • Price: 0.9067
  • TP: 0.9047 (20 pips)
  • SL: 0.9087 (20 pips)

SELL Signal AUDUSD 8 August 2013

Here is the sell signal for AUDUSD 8 August 2013. I have been short AUDUSD at 0.8987 and my target is 0.8967. Its a good signal and hope my target will hit.

audusd-sell


Trade result Buy EURUSD @1.3322 7 August 2013

Here is the trade result for my previous BUY signal on EURUSD pair. This trade was taken about 1 hour ago and now my profit target was hit.

Here is the current EURUSD chart after my TP was hit.

trade result eurusd 1


BUY EURUSD @1.3322 on 7 August 2013

I just open a Long transaction on EURUSD pair on 7 August 2013. This trade is based on Fibonacci breakout with level 161.8 fibo level as the target.

eurusd-signal-7-aug-2013

I open the trade a bit late because I just seen this signal. As the target was not reached yet, so I still can open the trade with  about 13 pips as my target. Here is the trade details:

  • Pair: EURUSD
  • Price: 1.3322
  • Direction: Long/BUY
  • Target: 1.3333
  • Stop Loss: N/A

See you on the next post I hope this will be a green pips for me :)

Trade signal EURJPY 8 August 2013

Before you continue to read this post, please note that this is a free signal. Thus there is no guarantee that this signal is 100 percent accurate. This signal is calculated using fibonacci breakout strategy and tested many times. But still, you will need to manage your risk.

Signal for EURJPY, valid until 8 August 2013

Place a pending order BUY stop with the following details:

  • BUY stop: 129.50
  • Take profit 1 : 129.90 (40 pips) -- recommended
  • Take profit 2 : 130.70 (120 pips)

Put your stop loss based on your own risk management. Since this is a breakout strategy, it's about 1:1 risk reward ratio. The take profit level can be increased based on todays low of EURJPY (7 August 2013).

How to trade trendline breakout with Fibonacci

This method has been popular on some websites and there are also many people trade using this strategy. The idea of this trendline breakout with fibonacci is when price break a trend line, we wait until it break 100 Fibonacci level and the target is the next Fibo level.

Its a good trading strategy but the main problem is the stop loss. The stop loss is quite large. But its very accurate if we do it in correct manner. See the example below.

fibo-1


Good hidden divergence trading setup on EURJPY 26 July 2013

This post is a back test which is for learning process only. I could not write the post when price still running because I have to manage and take care of my own trading. I hope this post can give a better visualization for future trading setup using hidden divergence strategy. Starting from early morning of 26 July 2013, EURJPY has made a strong down trend. This down trend was confirmed by the price moving below 50 EMA on M15 time frame.

This strategy is to follow the trend with hidden divergence confirmation. The stop loss should be placed few pips above the previous high (on a down trend). My suggestion is to put the stop loss a bit wider because sometimes price made a spike and hit your stop loss if you put it too tight. I usually put the stop around 20 pips because 20 pips with 0.1 standard lot is my risk on every position I took. I don't want to lose more than 20 dollar on each trade.

I also do not use Take profit when I am in front of my laptop. I will manually move my stop loss when I am floating in profit. By doing this, I can maximize my profit. I move my stop loss to break even when I am in 10 pips winning position. By doing this I can minimize my losing chance.

Trend following trade with hidden divergence confirmation

Trend following is the safest and is the most popular trading strategy among traders in the world. The idea here is to ride the current trend in selected time frame with hidden divergence confirmation. The following indicators are needed:

  • MACD (default setting)
  • EMA 50
  • Stochastic oscillator (default setting)

Entry rule:

  • When price is above the 50 EMA, we only go Long. When price is below 50 EMA we only take Short position.

Long entry:

When MACD bars are above the zero line and price is above the 50 EMA, it indicates that the current trend is UP. We try to catch the trend by identifying the hidden divergence on Stochastic. See example below

hidden-div-1


How to trade trend line breakout with 10 pips target

This post will show you where is the exact trade opening position using trend line breakout strategy. Trendline break out is a simple and profitable technique if we draw the correct trend line. I use MACD Histogram to confirm my trendline breakout. When price break the trendline, I check if MACD Histogram flip over. This confirm my entry point. See how it works below.
Please note that this strategy only look for 13 pips (minus 3 spread)

Trendline breakout trading on EURJPY 31 July 2013

Trend line breakout is a simple and powerful trading strategy that works on any time frame and pairs. Here I want to show you a nice bullish breakout trading EURJPY on 31 July 2013. With a proper stop loss we can gain many green pips without having to lose your account.

trendline breakout eurjpy 1

On the chart above, I draw a trendline connecting highs. When price move up and break this trend line, I open buy with stop loss below the previous low. I only take 10-20 pips per trade and that's enough for me. Now I am waiting for the price to retrace down and maybe give a good sell signal.

5 pips per trade with trendline breakout strategy

Its now time for scalper. What do you think if we can get 5 pips per trade. Is it enough for you? For some people, 5 pips is garbage and not worthy but think again. For example we can open position 10 times per day, we can get 5x10 equal 50 pips per day. This method that I will show you give a pretty good probability. See my transactions today below

scalper-5-pips

Click the image for larger view.

So, which technique that I used to get the above result? The answer is trend line breakout. I tried many indicators and EA but its too complicated to follow. Metatrader already equipped with many powerful tool we can use to trade with simple. See how I trade trend line breakout with only 8 pips target (minus 3 for spread). The only indicator that I am using is the EMA 60 as the trend indicator. I trade along with the trend. If the price moving above the EMA, I only take Long and if the price moving below the EMA 60 I only take short.

5 pips strategy

Scalping using TDI and MACD Histogram indicator

To scalp and get few pips per trade, we can easily using TDI combined with Colored MACD Histogram indicator. We read the MACD bar to determine the micro trend and use TDI cross over as the open position confirmation. 
Indicator used:
  • MACD Histogram
  • TDI Red Green
You can easily get those indicators for free on many Forex forum on the net. Here is the example
As you see on the chart, we open BUY when MACD bar already green and TDI indicator cross between the green and red line. Our target is 10-15 pips depends on the situation. EURJPY M15 time frame is the best to scalp using this technique. 

Scalping technique with MACD Histogram and trend line breakout

MACD Histogram is a good tool to help a scalper like me to enter the market any time whenever there is a trend line breakout. This indicator helps me to confirm the trend line breakout and get some pips (10-20 pips) on M15 time frame.

macd scalping

On an up trend, draw supports line by connecting the significant lows of the uptrend. We prepared ourselves to catch the retracement or reversal possibilities. When the price break our trend line, check if the MACD Histogram bar already in RED color. Usually, the bar already turned red before the breakout.

Bullish divergence on USDCHF 17 July 2013

A nice bullish divergence was developed on USDCHF pair on 17 July 2013. After few days USDCHF made a nice down trend, today I spot a bullish divergence on hourly time frame.

usdchf bullish div

Compare my dotted arrows on the price and on the indicator. The The discrepancy between the price and indicator develop a divergence. Price made lower low but MACD Histogram made a higher low. It's a bullish divergence.

I always use a trendline to help me open my trade. When the price break the trend line, I can open my trade confidently.

Pivot Point bounce trading system

Pivot Point, Support, Resistant are important parts on Forex trading. Price is respect to these. I always load my Support and Resistant indicator on my chart. On this post, I want to show you how price bounce on Pivot Point line and we how we trade it. By its theory, when price break S&R line, it will continue to move up or down. But sometimes, we can use the bounce of the S&R line to open a trade.

pivot

On the chart above, see how price tested the Pivot line twice before it break the line and move down significantly. For a scalper with 10-20 pips profit target, we open a position on a pivot line bounce. Put the stop loss below the line when buy and above the line when sell.

How to trade hidden divergence the right way

Hidden divergence is a powerful trading setup when we manage it correctly. The example below will show you how to trade hidden divergence the right way. Both normal or hidden divergence need a confirmation before it really a normal or hidden divergence. A good confirmation is the trendline breakout. And as my own experience, MACD Histogram is the perfect indicator to detect divergence. See example below (M15 time frame)

hidden div breakout


Trend line breakout with TDI Cross Over

Trading trend line breakout can be profitable if we do it in a good manner. In Forex, there are many false breakout. To avoid false breakout signal, I often use other indicator such as TDI red green cross line.

trendline-tdi


Get ready to buy EURUSD H1 time frame 13 July 2013

I am currently waiting for a bullish hidden divergence on EURUSD pair 13 July 2013 H1 time frame. If we look at the chart below, we see that EURUSD made a nice up trend on H1 time frame and at this moment the retracement still in progress. CCI indicator has made lower low and a trend line break would be a good confirmation to get 20-30 pips I think.

trade signal EURUSD 11 july 2013

I think it's a good trade signal. But make sure a trend line break is full filled before open BUY position.

Bearish divergence on AUDUSD 11 July 2013 H1 Time frame

Sorry late to post this signal because I am still working. This is my first day working on my exploration company after 1 month long leave. I spot there was a nice bearish divergence on AUDUSD 11 July 2013 H1 time frame.

bearish divergence audusd 11 july 2013


Based on original Visionary template by Justin Tadlock
Visionary Reloaded theme by Blogger Templates
This template is brought to you by Blogger templates

Visionary WordPress Theme by Justin Tadlock Powered by Blogger, state-of-the-art semantic personal publishing platform