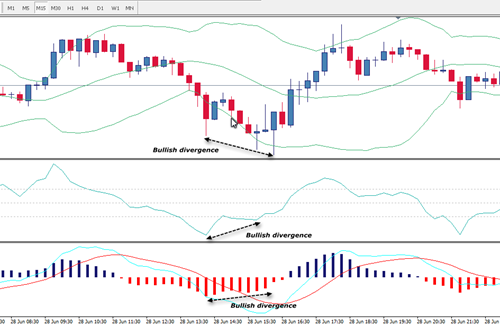
CCI Divergence breakout on NZDUSD M15 time frame 28 June 2013

I love to write and learn about divergence on this blog. Here I want to show another example of CCI divergence with trend line breakout confirmation on NZDUSD 28 June 2013. I always use a trend line break confirmation to open and trade a divergence. And the following chart will explain how to trade CCI divergence.

nzdusd cci div breakout


USDCHF Divergence trading 28 June 2013 on M15 time frame

USDCHF on 28 June 2013 did not make any clear trend. It show a sideway movement all day. As usual, divergence trading can give us some nice pips for a divergence scalper like my self. The setup below show a bullish divergence trading on USDCHF M15 time frame on 28 June 2013. About 30 pips are secured.

usdchf-divergence


Hidden Divergence trading setup AUDUSD 27 June 2013

USD shows its power compared to Australian Dollar on 27 June 2013. After making a nice up retracement, now AUDUSD is continuing to fell down. I found a nice trading setup on H1 spotted by a nice hidden divergence on CCI indicator H1 time frame.

AUDUSD hidden div 27 june 2013


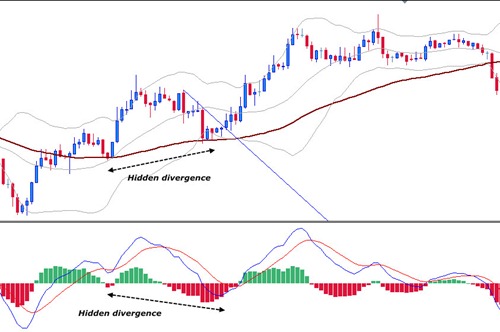
MACD Histogram hidden divergence trading

MACD Histogram is a very lagging indicator and always late. That's why I do not recommend to trade using MACD Histogram flip or signal cross over. MACD Histogram is very powerful to detect divergence. Divergence fake out is less when using this indicator. Personally, I prefer to trade hidden divergence on any time frames. Since I am a scalper, I only look for 10-30 pips on each trades I take. Here is the example of the hidden divergence reading using MACD Histogram.

Indicators:

  • MACD Histogram
  • Bollinger Bands
  • Simple Moving Average (60 period)

hidden-di-explained


Bullish divergence signal NZDUSD 21 June 2013

I spot a nice Bullish divergence signal on NZDUSD pair on 21 June 2013 H1 time frame. Since its Friday, so we need to see it on next Moday 23 June 2013. MACD Histogram shows a nice divergence on the bottom and I hope the price will move up significantly or at least 30 pips in advance.

divergence-nzdusd-predict


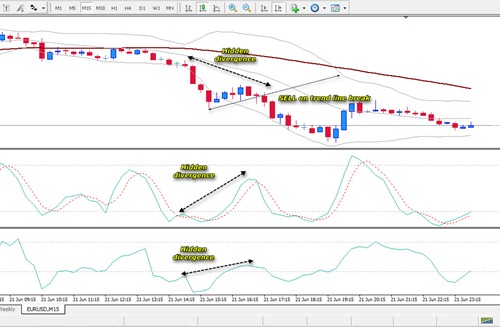
Hidden divergence trading EURUSD 21 June 2013

EURUSD current trend is down on H1 and lower time frame at least. And its time to ride the trend by identifying any hidden divergence on M15 time frame. The price has broke the lower Bollinger Bands and seems to continue and as usual, hidden divergence was there.

hidden-div-eurusd


Bearish divergence trading EURJPY on 21 June 2013

I found a nice bearish divergence signal on EURJPY pair on 21 June 2013 M15 time frame which gave me +30 pips in advance. In last few hours, EURJPY trend is up about 130 pips. I cannot get into this potential trade because I do not watch the market. But when I open my MT4 I spot a bearish divergence which gave me a SELL signal as follow

bearish-divergence-eurjpy-210613


Scalping with Stochastic hidden divergence

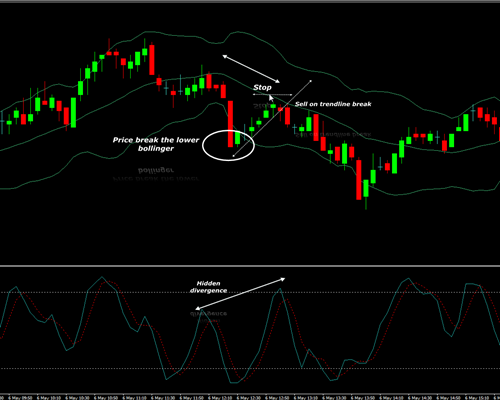
On this post I want to show you how to trade/scalp with a Stochastic hidden divergence signal. Its an interesting trading system with high probability profits. Even I cannot guaranteed that this system will work for you but at least it works for me so far. Hidden divergence often occur when price has made a new trend no matter its up trend or down trend. Then the price will enter the retracement process. Hidden divergence will give signal when the retracement process is finished and start to continue the trend. 
Below is the bullish hidden divergence on AUDUSD M15 timeframe. 

CCI Divergence breakout AUDUSD 19 June 2013

Actually I want to post any divergence signal that I trade but since I am not a full time trader, I don't have much time to write posts for any divergence signal I trade. But I hope this post is useful for my future trading decision based on divergence. On the example below, I want to show you a nice divergence setup on AUDUSD 19 June 2013 M15 time frame. 


How to trade Divergence correctly

Divergence is a powerful way to determine the price retracement or reversal. By its definition, divergence is a disagreement of the price movement and the oscillator/indicator. There are many indicator used to detect divergence such as Stochastic, CCI, RSI, MACD and some others. If we trade this divergence correctly, we can gain more profits from Forex. See how divergence works on price chart below.
1. Bullish Divergence

Learn How to trade Stochastic hidden divergence

Hidden divergence happens when price has made a new trend (up or down) and hidden divergence indicates that the trend will continue. For example when price has made a new trend, breaks upper Bollinger Bands do not think to SELL too early. Its wiser to catch the trend by identifying any hidden divergence the at may occur on the chart.

hidden-divergence-trade


CCI Divergence breakout AUDUSD M15 18 June 2013

CCI Divergence breakout is my favorite trading system that give me a lot of profits in last few months. This kind of setup is pretty easy to understand and to trade even for a newbie. The following chart shows a nice CCI Divergence breakout on AUDUSD pair on 18 June 2013. Since I am a scalper, M15 time frame is preferable and profitable for me.

cci-divergence-audusd-18-june-13


Trading result of divergence on EURJPY 21 June 2013

Finally, after about 1 hour my last trade setup hit my take profit of +20 pips. This trade utilize the divergence signal on EURJPY M15 time frame on 21 June 2013. Read my previous post of this trading setup.

trading-result-1


Divergence trade signal EURJPY M15 on 21 June 2013

Its early in the morning of 21 June 2013 I spotted a divergence on EURJPY pair on M15 time frame. I just opened my trade BUY EURJPY  at 128.51 and my target will be around 128.61 - 128.85.

divergence-trade


CCI Hidden Divergence setup NZDUSD M15 on 20 June 2013

NZDUSD has made a down trend since 19 June 2013 but I could not get into the trade and follow the down trend. But on 20 June 2013, I still see a chance to get into the trade by spotting a nice hidden divergence on my CCI indicator. Since I am a scalper, I only take few pips for all my trades. Scalping with CCI divergence is a fun.

hidden-div-breakout-nzdusd


Hidden Divergence Trading USDJPY on 20 June 2013

USDJPY has made a nice up trend since 19 June 2013 evening and it continue to move higher on 20 June 2013. Hidden divergence is a good trading set up to jump into the current trend. Here is the setup I took on USDJPY M15 on 20 June 2013.

hidden-div-usdjpy


Scalping using MACD Histogram and Hieken Ashi indicator

Scalping is a profitable trading system if we do it correctly. Here I want to share another scalping method using Hieken Ashi and MACD Histogram indicator. This system can be used on any time frames but M15 or higher is preferable. The idea is that when the Hieken Ashi gives buy or sell signal, it must be confirmed by the MACD Histogram flip over. 10-20 pips is a good target on M15 timeframe using this system. 

Hidden Divergence trading USDJPY M15 17 June 2013

I love hidden divergence which has given me more profits each days. This post will show you a nice hidden divergence setup on USDJPY 17 June 2013. I use M15 time frame to enter my position. I saw USDJPY has made a nice up trend. The idea is to follow this uptrend. How to trade along with the current trend? The key is to spot hidden divergence. Hidden divergence by theory will continue the trend. As usual, I use a trendline breakout to confirm the hidden divergence.

Indicator:

  • Stochastic Oscillator (9,3,3)

hidden-div-breakout-usdjpy


Scalping with Scalper Point indicators

I just found a nice indicator called Scalper Point. This indicator plots most recent support and resistant using points. As a scalper, we can use this indicator as a warning sign of new wave. When scalper points shown on the top, it means that new resistant has been made and the price will move down. And when it shown on the bottom, the price will move up. But, I suggest to add another confirmation before opening position. Do not rely on this indicator only. I add my favorite MACD Histogram to confirm this signal.

scalper points


FXSniper's T3 CCI Trading System

FXSniper T3 CCI is a good indicator if it used with other indicator as confirmation. Actually it's a very nice indicator only if we can read and use it in a good and correct manner. I always use other indicator as confirmation or to support the signal given by this FXSniper T3 CCI indicator. Basically, the T3 CCI buy signal is given when there is crossover from the bottom (red bar) into the green one (green bar). But, for me, its not enough to give me confident to open my trade. So, on this post, I want to show you how to trade using T3 CCI with other confirmation.

1. FXSniper T3 CCI with trendline breakout

Trendline breakout has been my favorite trading tool. Any indicator will be good for me if it combined with this trendline breakout. T3 CCI also good if we use trendline breakout as confirmation. This method is good for scalping with 10-20 pips on each trade as the profit target. See illustration below.

t3-cci-with-trendline


FXSniper CCI Divergence breakout USDCHF H1 on June 13 2013

I was trying not to stick on one pair for my trading. I tried to look for any divergence signals on almost any pairs using my favorite indicator FXSniper's CCI. I will try to improve my self to recognize the divergence pattern and will learn to trade it every time. I use a trendline breakout to confirm the divergence and to open my position.

Here was the example of the divergence I spotted on USDCHF pair on June 13, 2013. I use H1 timeframe to trade but I always use the higher timeframes as the trend directions. I do not trade M15 or lower TF because there are many noise and false breakout on lower time frame. H1 is good for me.

fxsniper-divergence-usdchf-1


Trading result based on MACD Histogram Divergence

Hi, just want to share with you some nice green pips using MACD Histogram trading with divergence spotting.
I spot a positive divergence on the price chart. The price has made lower lows but the MACD histogram did not confirm that. It makes higher low. Then, I wait until the MACD line cross each other (blue line cross the red line from the bottom) which gives buy signal. As you can see, the price move up nicely.

MACD Histogram divergence trading

Trading divergence is the most profitable for me. As long as we open the trade on the right time, divergence can be your best friend in trading. MACD Histogram is a good tool to spot divergences and it also has signal line crossover which can be used as confirmation for the divergence. Here is the example of Hidden divergence shown by MACD Histogram and confirmed with the crossover.

MACD Histogram Divergence with TDI confirmation

Divergences, both hidden or normal gives me a better opportunity to win my trades. Personally I love to use MACD Histogram to detect the divergence and I need another kind of tool to confirm the divergence. MACD Histogram comes with signal line which can be used as divergence confirmation. Sometimes I use TDI (Trader Dynamic Index) to open my position along with the divergence shown by MACD Histogram. On the following example, I got about 28 dollar (4 lots with 9 pips TP).

divergence-tdi-cross


Trading result using TDI System - 10 June 2013

Hi, after posting some trading strategies, now its time to post my trading result. TDI System really works for me. I got some nice pips this morning with just about 1 hour trading I got 34 dollars. Also I got some nice rebate from Instaforex.

trading-result-tdi-system

How I trade that?

Ok, see and read my previous post about SHI Signal and TDI trading system. I warn you that SHI Signal is not a good indicator actually because the dots will move as new support or resistant is formed by the chart. So, NEVER use SHI Signal as buy sell decision. Its only for help. You can remove it if you want. The main buy sell signal is the TDI crossover.

Small pips but bigger trading lot-Are you dare?

Many professional traders or mentor said that we must have a target plan, good trading system to get consistent profit every day. For example, I have to reach 20 dollar per day. It's a good plan but we can do this in two different way. First options is to use 1 lot and try to get 20 pips. The second is use 2 lot and the target 10 pips or even we can use 5 lot and we need only 4 pips to get 20 dollar per day. Make sense right? All those options have their own risk and benefit. So which one you choose? Are you dare to use bigger lot and smaller pips target?

Imagine if you just open a position no matter buy or sell for 1 lot (1 dollar per pips) and currently floating profit 10 pips. Your take profit will be 20 pips for example. But, suddenly the market turn over against you and your 10 pips profit now turn into 10 pips minus and counting. Finally you cut loss or your stop loss hit by the market. This scenario will not happen if you use 2 lots and look for 10 pips only.

SHI Signal and TDI System worst case scenario

Adopted from Woody CCI system which believes that the FXSniper CCI will give both entry and exit signal, so the SHI Signal and TDI System also comes with that feature. SHI Signal and TDI System comes with built in entry and exit system. On this example I am going to show you the worst case when the exit signal ended with loss but we have another position which doubled the profit.

shi-tdi-system-worst case

On the chart above, we go Long after blue dot and TDI cross over, but the price did not go up further. Only single green candle and then it going down quite far. OK for example on our Long position we've taken on the first signal it should get about 32 pips but, maybe you hold your position and wait until you see the red dot appear. And when the red dot appear, say it you close your Long position with minus (just for example).

SHI Signal and TDI Trading System

My own dream is to be able to create a super simple system in Forex Trading. I know it's a crazy dream but I think I am close to that dream. Introducing the simple system based on SHI Signal and TDI indicator. This system works on any time frame but I recommend you to use M15 for scalping since we can have more positions on this TF.

Rule:

  • SHI Signal must present
  • TDI Cross over

You can add a trendline breakout for more confirmation if you want. But those two conditions must exist. No matter which one gives signal first. Sometimes, SHI dots comes first but sometimes the TDI does.

Example:

shi-tdi-system


Download SHI Signal indicator for Metatrader 4

SHI Signal is a colored dot indicator which tells us that current trend or price movement has reached the top or bottom. When price trending up and then SHI signal (red dot) appear, it indicate that the current up trend is going to retrace or even reverse. In a down trend when the green dot is appear, it indicate that retracement or reversal is forming.

shi-signal-indi-download


Trendline breakout with CCI zero line cross confirmation

Trendline breakout probably is the easiest trading technique. It can be profitable but if we don't careful, it also can kill our account quickly. There are many false breakout out there. The idea here is to find out the confirmation by adding some other indicators. Here I want to share a simple technique based on Trendline breakout with CCI cross zero line confirmation. This method can be used for both follow the trend or counter the trend. If you use this method for counter trend, you must be careful and make sure divergences already exist. Forget the breakout if there is no divergence.

Indicators:

  • Bollinger Bands (20 periods)
  • FXSniper CCI (standard setting) Download
  • M15 timeframe or higher


How to trade Stochastic divergence with TDI and trendline confirmation

Stochastic is a good indicator which can help us to trade forex. Personally, I use stochastic to detect any divergence occurrences in M15 (my favorite time frame). On this post, I want to show you how to trade Stochastic divergence with trendline breakout and TDI confirmation. To trade Stochastic divergence, the following rules must be met:

  • Divergence is exist (both hidden or normal divergence)
  • Trendline breakout
  • TDI cross over
  • Any time frame

Divergence is actually divergence when it break the trendline. If the price still moving and no breakout or reversal candlestick pattern exist, we cannot call it as divergence. This technique is good for scalping since we only take few pips (10-20 pips each position) Higher timeframe will produce more pips. Here is the SELL example with hidden divergence:

stochastic-divergence-tdi

CCI Divergence breakout trading strategy

Divergence trading is a profitable setup but we need another confirmation such as trendline breakout or reversal candlestick pattern. But most of my trades are based on divergence with trendline breakout.

div-breakout

CCI Divergence breakout trading strategy

Divergence trading is a profitable setup but we need another confirmation such as trendline breakout or reversal candlestick pattern. But most of my trades are based on divergence with trendline breakout.

div-breakout

How to trade without many indicators aka naked trading

Believe or not, Metatrader indicators are based on price. So theoretically indicators will change on price movements. It cannot predict the future price movements. Most newbie traders will look and search for a perfect indicators to trade with. But I am telling you, the most valuable indicators already built in your head. Its your brain. naked-trading

Trendline breakout with NonLag MA confirmation

I do love trendline breakout system which combined with several confirmation. For example, divergence with trendline breakout, trendline breakout with NonLag MA confirmation etc. Since NonLag MA is a fast indicator which gives you buy or sell signal faster than most indicator, you will need another technique to confirm it. And when NonLag MA is combined with trendline breakout, it will be a good way to trade Forex. See my example below

non-lag-breakout

Trading based on NonLag MA and MACD Histogram indicators

NonLagMA is a fast indicator which showing the directions of current market. Its pretty easy to trade with it but you will need another confirmation to confidently enter the trade. On this example, I am going to show you how to trade NonLAG MA with MACD Histogram as the confirmation.

Rule:

We enter position when NonLag MA change color and MACD Histogram flip to the same direction with your trade.

nonlag-ma-technique

Trading hidden divergence using FXSniper Ergodic CCI Trigger

On my previous post I've written about how to trade using FXSniper Ergodic CCI by utilizing the crossover only. Like many other oscillator, FXSniper Ergodic CCI can also be used to detect divergences. And the safer divergence is hidden divergence. When price make higher high but the the indicator makes lower high and opposite. This method still use the cross over as the trade signal. The divergence will add more confident to our trade.

ergodic-divergence

Scalping using FXSniper Ergodic CCI indicator on M15 time frame

A good forex strategy has to be simple and not confusing with so many indicator. As long as protective stop always used on every position and we keep discipline to stick on the system, I am sure your will end up in profit. Here I want to share another simple system that can be used for everyone. This system uses FXSniper Ergodic CCI indicator only. We don't have to know the trend using another indicator such as MACD, Moving Averages or predict how the price will move etc.

How this system works:

OK since there is no such indicator that works 100 percent, you must keep in mind that some times, your stop loss will be hit and this does not mean this system does not work. The basic system of this open the trade when the FXSniper Ergodic CCI cross over.

ergodic-system

How to trade overbought zone FXSniper CCI

The idea of this system is when price is leaving the overbought zone, we prepare our self to sell the pair. But, in many cases, the indicator can stay in overbought zone for long period and price still move up significantly. That's why we only trade SELL when CCI leaving overbought zone and entering the +100 zone. This system will give better result when hidden divergence exist,


How to trade hidden divergence using FXSniper CCI in safe way

Trading using FXSniper can be done in several ways. We can trade using Zero line cross over only, tight stop loss and stick with it. Or, we can add another technique but still based on FXSniper CCI. Like another oscillator indicator such as Stochastic, FXSniper can be used to detect divergence.

fxsniper-divergence-1

Simple System - How to trade using FXSniper's CCI

FXSniper's CCI is truly a powerful indicator if we know how to trade with it. Woody 's CCI Club is a popular trading club which help other traders to success in forex with their own system based on FXSniper's CCI. But here I do not want to discuss about Woody's trading system. I want to show you how to trade with FXSniper's CCI in a dumb way. Sorry but its really simple system that anyone can follow it. But off course stop loss always used tightly.

Rule:

  • Buy when FXSniper's CCI cross above zero line
  • Sell when FXSniper's CCI cross below zero line

Other traders suggest to wait the second bar to open the trade as confirmation but I think we can open the trade immediately when CCI cross zero line, as long as our stop loss is placed few pips below or above previous high or low. See example below

Please note that its wiser to check the stop loss position before we enter the trade. If the previous low or high that we use for stop loss is too far, its better to wait to the next signals.

fxsniper-cci-trade

Trading hidden divergence using Stochastic

The best way to trade is by following the trend. But for some people its hard to find the moment to enter the trade and go with the trend. On this example I want to show you how to enter the trade and follow the current trend on current time frame. The idea here is let the price make a new trend up or down. I usually use Bollinger Bands to identify the trend. If the price breaks upper or lower bands, I do not enter the trade at that time. I wait and see if the price makes a new trend. Sometimes even the candle breaks the upper or lower bands it will bounce. So I wait few more candles to see if there is a new down or up trend is forming.

hidden-div-stochastic

Based on original Visionary template by Justin Tadlock
Visionary Reloaded theme by Blogger Templates
This template is brought to you by Blogger templates

Visionary WordPress Theme by Justin Tadlock Powered by Blogger, state-of-the-art semantic personal publishing platform