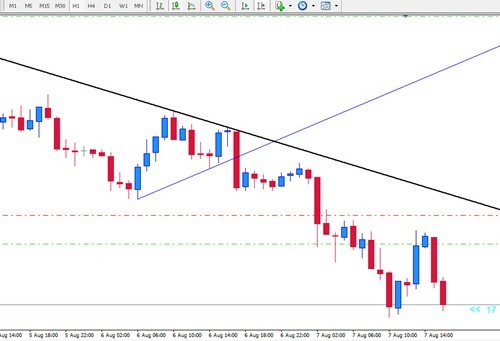
Failed long wick signal

On my previous post, I’ve shown a successful long wick trading signal. Here I am going to show you how the long wick signal can be failed as well as any other signal. Since there is no such a perfect system, stop loss always the savior for every trading setup.

failed long wick


Price action trading using long wick candle signal

I like to trade based on price action with no indicator attached on my chart. I don’t like any indicators on my chart because it makes me confuse sometimes. Now, I am learning to trade based on price action only. And the most price action signal that I love is the long wick/tail candle.

How to trade this long tailed candle?

long wick


Simple price action trading strategy-pin bar candlestick

In last couple days I searched for any new profitable Forex method without any indicator. I started with Fibonacci breakout and it works pretty well. Now, I am trying to combine the Fibonacci breakout and some other price action strategy. Price action is a good way to trade Forex currencies because if we rely on indicators, we will missed the momentum.

On this post, I am going to show some nice setup using pin bar candlestick or hammer type candlestick. I do not trade based on this pin bar only but, if we spot a pin bar candle, we can prepare ourselves to enter the trade as well.

Breakout trading on Gold 13 Aug 2013

I just open Long position on Gold. This position is based on my trendline breakout.

buy-gold-1

Gold has just broke the trendline and latest resistant area. I hope this breakout is valid and can hit my Take Profit area.

Here is my trade:

  • Position: BUY/Long
  • Lot: 0.2
  • Price: 1336.57
  • TP: 1339.0
  • SL: 1333.42

Will see on the next few hours.

Catch the breakout earlier on lower time frame

In many cases, for example if we use M15 as our base for breakout trading, we can only get few pips and then the price already reverse against us. To avoid this, we can use lower time frame to catch the breakout earlier. See example below

M15 time frame trade setup

m15 breakout


10 pips strategy based on breakout

Hi, see you again in this blog. Here I want to share how to get 10 pips per trade with trendline breakout. Its a simple strategy without any indicator. You only need to learn how to draw trendline connecting supports or resistant. This strategy applies to any pairs and any time frame but I recommend to use M15 because we only want to get 10 pips .

SELL condition

10pips strategy-1


How to trade trendline breakout without any indicator

Believe or not, any indicators are based on price. So, they will be always late and formed after the price. Personally, I don't like fancy indicators. MT4 application already equipped with many powerful indicators such as Bollinger Bands, CCI and Stochastic. I think with those indi, you can be successfully in trading. The key is risk management.

Here I want to show you how to trade without many confusing indicators. We will try to trade based on price action only with trendline. As long as I learn Forex, trendline breakout give me better result than any other strategy. Indicators such as Stochastic, CCI and MACD are helpful when there is divergence.

SELL signal on AUDUSD 8 August 2013

Its currently 9.30 PM on my time zone and today AUDUSD has made a pretty nice up trend. My previous SELL signal on AUDUSD hit my stop loss at -50 pips. I loss 50 dollar today but its fine. Now I am preparing a SELL position on AUDUSD. Wait until the price break the trend line and I think it safe to get 20 pips down ward.

audusd sell

Here is my trade setup

  • Pair: AUDUSD
  • Timeframe: M15
  • Position: SELL stop
  • Price: 0.9067
  • TP: 0.9047 (20 pips)
  • SL: 0.9087 (20 pips)

SELL Signal AUDUSD 8 August 2013

Here is the sell signal for AUDUSD 8 August 2013. I have been short AUDUSD at 0.8987 and my target is 0.8967. Its a good signal and hope my target will hit.

audusd-sell


Trade result Buy EURUSD @1.3322 7 August 2013

Here is the trade result for my previous BUY signal on EURUSD pair. This trade was taken about 1 hour ago and now my profit target was hit.

Here is the current EURUSD chart after my TP was hit.

trade result eurusd 1


BUY EURUSD @1.3322 on 7 August 2013

I just open a Long transaction on EURUSD pair on 7 August 2013. This trade is based on Fibonacci breakout with level 161.8 fibo level as the target.

eurusd-signal-7-aug-2013

I open the trade a bit late because I just seen this signal. As the target was not reached yet, so I still can open the trade with  about 13 pips as my target. Here is the trade details:

  • Pair: EURUSD
  • Price: 1.3322
  • Direction: Long/BUY
  • Target: 1.3333
  • Stop Loss: N/A

See you on the next post I hope this will be a green pips for me :)

Trade signal EURJPY 8 August 2013

Before you continue to read this post, please note that this is a free signal. Thus there is no guarantee that this signal is 100 percent accurate. This signal is calculated using fibonacci breakout strategy and tested many times. But still, you will need to manage your risk.

Signal for EURJPY, valid until 8 August 2013

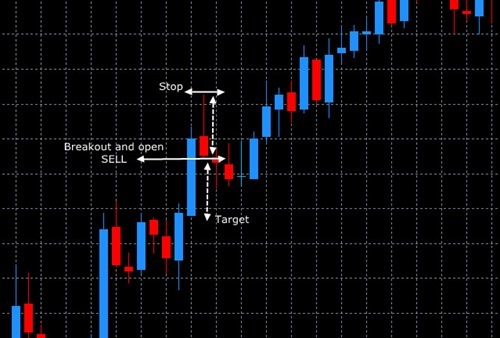
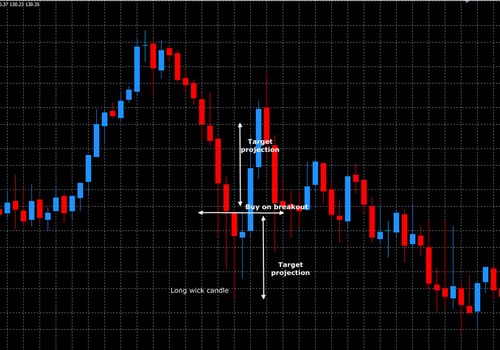
Place a pending order BUY stop with the following details:

  • BUY stop: 129.50
  • Take profit 1 : 129.90 (40 pips) -- recommended
  • Take profit 2 : 130.70 (120 pips)

Put your stop loss based on your own risk management. Since this is a breakout strategy, it's about 1:1 risk reward ratio. The take profit level can be increased based on todays low of EURJPY (7 August 2013).
How to trade trendline breakout with Fibonacci

This method has been popular on some websites and there are also many people trade using this strategy. The idea of this trendline breakout with fibonacci is when price break a trend line, we wait until it break 100 Fibonacci level and the target is the next Fibo level.

Its a good trading strategy but the main problem is the stop loss. The stop loss is quite large. But its very accurate if we do it in correct manner. See the example below.

fibo-1


Good hidden divergence trading setup on EURJPY 26 July 2013

This post is a back test which is for learning process only. I could not write the post when price still running because I have to manage and take care of my own trading. I hope this post can give a better visualization for future trading setup using hidden divergence strategy. Starting from early morning of 26 July 2013, EURJPY has made a strong down trend. This down trend was confirmed by the price moving below 50 EMA on M15 time frame.

This strategy is to follow the trend with hidden divergence confirmation. The stop loss should be placed few pips above the previous high (on a down trend). My suggestion is to put the stop loss a bit wider because sometimes price made a spike and hit your stop loss if you put it too tight. I usually put the stop around 20 pips because 20 pips with 0.1 standard lot is my risk on every position I took. I don't want to lose more than 20 dollar on each trade.

I also do not use Take profit when I am in front of my laptop. I will manually move my stop loss when I am floating in profit. By doing this, I can maximize my profit. I move my stop loss to break even when I am in 10 pips winning position. By doing this I can minimize my losing chance.

Trend following trade with hidden divergence confirmation

Trend following is the safest and is the most popular trading strategy among traders in the world. The idea here is to ride the current trend in selected time frame with hidden divergence confirmation. The following indicators are needed:

  • MACD (default setting)
  • EMA 50
  • Stochastic oscillator (default setting)

Entry rule:

  • When price is above the 50 EMA, we only go Long. When price is below 50 EMA we only take Short position.

Long entry:

When MACD bars are above the zero line and price is above the 50 EMA, it indicates that the current trend is UP. We try to catch the trend by identifying the hidden divergence on Stochastic. See example below

hidden-div-1


How to trade trend line breakout with 10 pips target

This post will show you where is the exact trade opening position using trend line breakout strategy. Trendline break out is a simple and profitable technique if we draw the correct trend line. I use MACD Histogram to confirm my trendline breakout. When price break the trendline, I check if MACD Histogram flip over. This confirm my entry point. See how it works below.
Please note that this strategy only look for 13 pips (minus 3 spread)

Based on original Visionary template by Justin Tadlock
Visionary Reloaded theme by Blogger Templates
This template is brought to you by Blogger templates

Visionary WordPress Theme by Justin Tadlock Powered by Blogger, state-of-the-art semantic personal publishing platform