FXSniper's CCI Divergence trading setup

Trading divergence is profitable (with less stop loss) and can gain more profit. This post will show you a pretty nice trading setup based on FXSniper's CCI Divergence. FXSniper CCI is a modified CCI indicator. You can download FXSniper CCI from this link if you don't have already.

Negative Divergence occurs when price makes higher high but the indicator make lower high instead of higher high.

fxsniper-divergence

Trendline breakout with CCI confirmation system

Trendline breakout is a simple but profitable system in Forex. You don't have to learn many indicators, systems, forex tools just to get profit. If we do discipline and consistent with trendline breakout we can get rich (sorry to say this but its true). But, trendline breakout has many fake outs that can wipe out our account. Here I want to share a simple system using trendline breakout with CCI confirmation. CCI only used to confirm the breakout. If both condition do not met, do not enter the trade. 
Rule
  • Price break the trendline up or down
  • CCI must be higher than 100 level (for long position) or lower than -100 level for short position
If only one of the rule is met, I do not enter the trade.
Example for trendline break but CCI does not goes below -100
 On the picture above, price seems to break the trendline but the CCI does not go below -100. The price still move up and make new higher high. Actually we can go short here and put our stop on the previous high. 

My MACD Histogram Hidden divergence trading setup on GBPUSD M15 29 May 2013

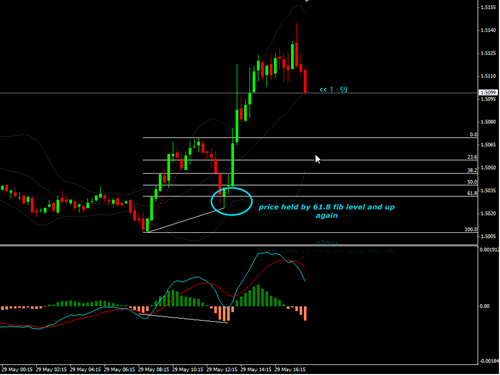
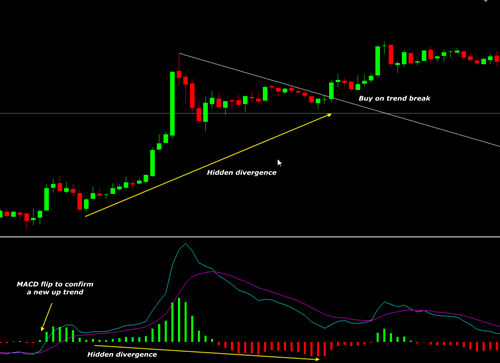
Sorry for my previous post, the title and the content does not match. It should be a normal divergence not hidden divergence and I was using MACD Histogram indicator on that post, not CCI. OK, now I want to write about a good setup entry based on Hidden divergence spotted on GBPUSD M15 time frame on 29 May 2013. Hidden divergence is a good way to ride the trend on the current time frame. As always, trendline breakout was used to confirm the divergence. If you understand fibonacci retracement, you can also use this tool to confirm the divergence.

macd-histogram-hidden div

CCI Hidden Divergence trading setup on GBPUSD M15 29 March 2013

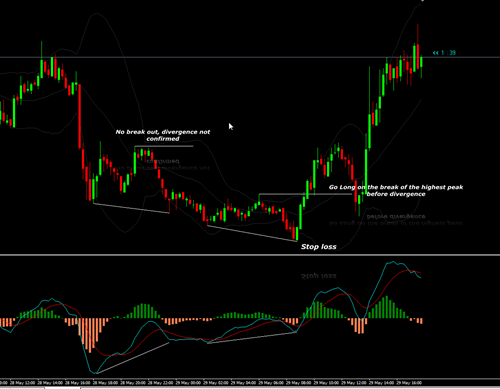
I found a nice setup based on my MACD Histogram divergence breakout on GBPUSD pair on 29 March 2013. There was a nice positive divergence and followed by a nice hidden divergence. Divergence actually happened on any pairs and any time frame but how to confirm it and how to start open the trade is another matter. So, divergence needs to be confirmed first before we take actions.

divergence-macd-breakout

Download A Simple Way to trade 2 Minute S&P PDF

If you like to trade S&P e-mini, you may want to download this profitable system that is very simple and good for anyone at any trading level. Its in PDF format which can be viewed or printed easily. This is a Simple Way to trade 2 minute S&P. It consist of a clear explanation how to trade the 2 minute time frame in S&P.

This system uses several indicators such as:

  • MACD Histogram
  • 89 period moving average

Download MACD Histogram indicator for MT4

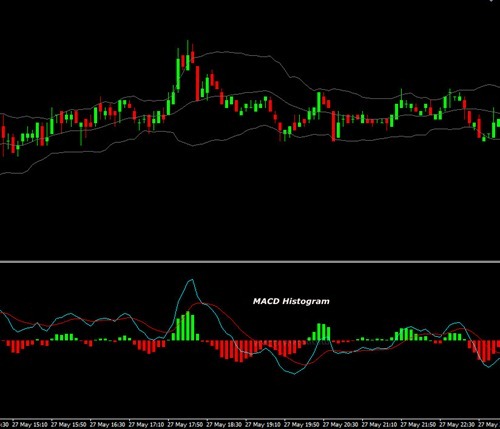
MACD Histogram is a custom indicator for Metatrader that is powerful in its way. There are several ways to read this MACD Histogram. Personally, I use MACD Histogram to spot any divergence that occurs and trade it.
macd histogram
 

Failed divergence example on M15 time frame

Since there are no such system that gives 100 percent accuracy in trading, the divergence it self sometimes also gives false signal. So, I highly recommend to use a trendline break to confirm the divergence. Sometimes even the indicator shows the divergence but the price still continue the trend because there is a very strong movements on the market.

div-failed

MACD Divergence with trendline breakout confirmation

Divergence is a perfect indication to know when the trend is going to end. When we spot a divergence,the price is going to retrace or even make a reversal. But, divergence it self needs a confirmation. And the best confirmation is a trendline break out. When divergence already formed and the price moving to the other side and break the trendline, there is a higher probability the price is going to reverse. See the reversal example below

reversal

Risk Management adalah kunci sukses trading

Setelah mencoba mempelajari trading Forex dengan beragam metode dan system, saya sedikit banyak sudah mulai bisa menarik kesimpulan sementara. Sama seperti para professional trader yang sudah jauh lebih berpengalaman, kunci dari keberhasilan di dalam forex adalah sebuah Risk Management. Ya, manajemen resiko menurut saya adalah kunci dari trading. Kenapa saya bilang begitu? 
Forex merupakan sebuah sistem perdagangan atau investasi dengan tingkat volatilitas paling tinggi. Pergerakannya sangat cepat dan tentunya ini adalah sebuah pisau bermata dua. Bisa membuat kita cepat kaya sekaligus cepat bangkrut. Kadang, saat kita sudah profit, dalam beberapa menit profit tersebut bisa menjadi floating minus yang besar. Kalau minus itu kita biarkan berlama-lama, kita berharap harga akan kembali searah dengan kita maka bisa-bisa habis dana kita alias MC (Margin Call). Untuk itulah diperlukan sebuah manajemen resiko yang baik dan ketat. 

Download MT4 indicator (Gann_HiLo_Activator_v2.ex4)

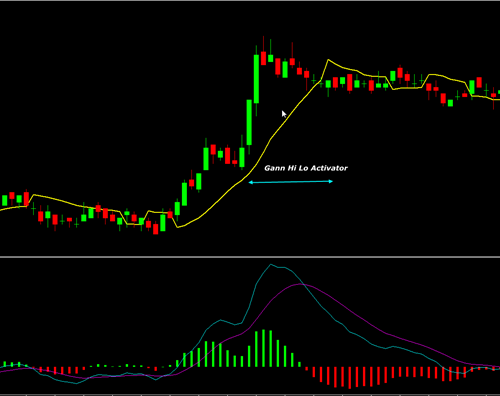
Gann_HiLo Activator MT4 indicator is a custom indicator to identify the current trend on the selected timeframe. But this indicator is good for H1 and higher time frame. Here is the screenshot for this Gann Hi_Lo Activator indicator for Metatrader.

gann hi lo activator

M5 Scalping strategy based on Hidden divergence breakout

Assalamualaikum

The best and safe way to open the trade position is along with the trend. But many traders including me prefer to trade against the trend and hope for a trend reversal or retracement. I don't know why I am doing this. But actually if we stick to a system with tight stop and discipline, I am sure we will success on trading. The keyword is tight stop.

Divergence or hidden divergence must be confirmed with other conditions such as trendline break or candlestick patter. If both are exist then a good trade opportunity is on the way. On this example I will show a trade setup on M5 EURJPY pair. It based on hidden divergence and trendline breakout.

hidden-div-breakout

Trend following trading with MACD Histogram and Trendline break

Hi, on my previous trendline breakout trading I already show you how to trade the trendline breakout on a trend reversal. So actually this method will give the best result if the price is really make a trend reversal on the selected time frame. Here, I want to show you how to trade by following the trend using Trendline breakout confirmation and MACD Histogram is used to determine the trend.

trend-break-2

How to trade trendline breakout

I do love divergence but my entry points are always confirmed by a trendline break. On this example I want to write my note about the trendline breakout trading. Trendline breakout can be very profitable if we stick to this method anytime. Like any other system, trendline breakout also comes with its fake out and loss possibilities. But, if we can manage our risk accordingly, I am sure you will be ended up in  profit.
OK lets get started.
Basically, trendline breakout can be drawn in both directions, against the trend or follow the trend. See the example below.
trend-break

My Successful Trade - Sell EURJPY M15 on 21 May 2013

Today I got some good pips on my basket. The first is 25 pips and the second is 20 pips. I think its enough for today. When the market opened in Monday, I saw a gap down on EURJPY and by the theory, this gap will be recovered. And finally in Tuesday 21st May 2013, the gap is covered and I got 25 pips. I know I can get more but I open my trade earlier and it was floating about -40 pips. But it ended in +25 pips.

OK I don't want to talk about the gap trading but, I just wan to show a nice SELL opportunity condition. As always, divergence must be present and there should be minimum 2 significant peaks that breaks the Bollinger Bands. Then, check other indicators such as Pivot Points to help our trade decision.

What is your favorite MT4 Indicator ?

Indicator actually formed to mirror the price so, the shape, form and the movement of indicator is based on the moving price. So, why should we believe the indicator if its only mirror the price? Well, on my own experience I mostly use some indicators. But, my trades are not taken based on the indicator only. It's about timing, its about feeling and intuition I guess.

For example, CCI and Bollinger Bands is two indicators that must be present on my charts. I use them to spot divergences, overbought and oversold zone but still the final decision is on myself. Even I saw a clear divergence I will not enter the trade if I don't feel to. It's a bit hard to explain.

forex_jpg

Believe me, there is NO perfect indicators in this Forex world. So, if you see any indicator advertisement, any offers that promise  99 percent accurate, I can tell you that it's a BULL SHIT!! Forex is about money, risk and mental management. You only need to learn the basic. And then, improve your self by using demo (even I do not recommend you to use demo in long term). After that, there is no other way to be success in Forex except to get into the real trade, real money.

The more you loss, the more you learn. Do not ever give up. You are failed only when you are give up.

CCI Divergence breakout trading on EURJPY 15 May 2013

A good divergence which followed by trendline breakout trading is a good entry point to get some nice green pips. Here is my trading setup on EURJPY on May 15th 2013. I use M15 timeframe to catch 20 pips target.

cci-trendline-breakout

On the chart, price creates two significant higher high which are outside the upper Bollinger Bands. Then, compare those two higher high with CCI indicator and it shows a clear divergence here. Actually we can go short confidently because the price failed to break the resistant line (red dot line). But a trendline breakout also gives a good entry confirmation.

When price opened below the trendline, I go short and the lower BB bands is my target. As you can see, the trade above gave me +24 pips to my basket.

Hidden divergence and Moving Average bounce system

Thanks for reading my Forex Trading journal. I am writing any post on this blog is based on my own experiences and I don't want to influence you or anyone to follow me or follow my trading strategy.

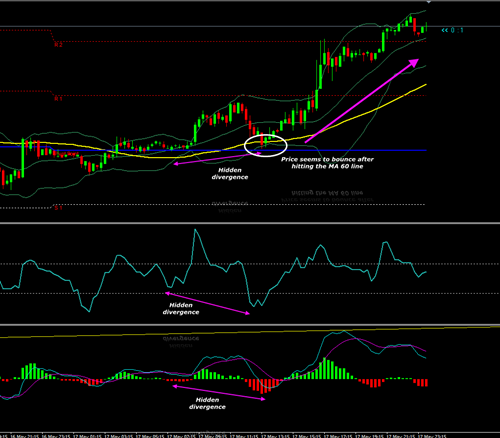
Here I want to share the trading opportunity using hidden divergence system with Moving Average (MA) bounce confirmation. EURJPY was making an uptrend after the USD fundamental news announcement on Friday 17th May 2013.

hidden-div-cci-2

Few minutes after the announcement (strong USD), EURJPY pair also respond it to make a new trend (M15). The candle break the upper Bollinger Bands nicely. I wait for the retracement first to follow the up trend. Then as you see, price retraces and hit lower bands and hit MA 60. At this point, both CCI and my MACD indicator shows discrepancy between price and indicator. Price making higher high but indicator making lower lows. On the next bar, I go long and as you can see price continue the up trend nicely.

Trading hidden divergence with Moving Average confirmation

I do love divergence both hidden divergence or normal one. I use three different indicators to spot divergence and enter the trade. On this post, I want to show a high probability trade setup based on divergence with Moving Average bounce.

Indicator I am using:

  • Bollinger Bands (20,2)
  • Moving Average (60)
  • CCI (14)

hidden-div-ma

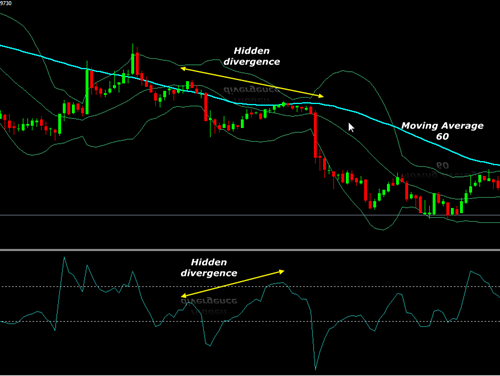
On M15 time frame above, AUDUSD pair is in down trend. It is wiser to trade along with the trend. OK, we compare those two tops that were make lower high but the oscillator (CCI) makes higher high. This is the hidden divergence. As you see, the price also hit the Moving Average line.

How to trade:

When the price/candle close below the moving average line, enter short with stop loss at the previous high (10 pips only on the example above).

If we open the M5 timeframe, it shows normal divergence. This condition is a perfect one, there is hidden divergence on M15 and normal divergence on lower timeframe (M5).

hidden-div-ma-2

Double Top trading - How to spot it

Another high probability trade setup is double top or double bottom. When I spot these condition, I prepare my self to enter the trade as long as CCI indicator is supported. See the example below, a perfect double top on EURUSD 15 minute time frame.


The red line is the Pivot point indicator that plot the Support and Resistant zone. On the picture above, price break the resistant line but failed and on the second attempt, it was failed as well and create a double top formation. 
How to enter the trade?
The aggressive one will go short right away after the first red candle is finished.

And the conservative one will wait for a valid break out

Both aggressive or conservative have pros and cons. The aggressive style has fewer stop loss compared to the conservative one. But it has bigger chances to get stopped out more often. 

Real scalping strategy on EURJPY M15

Scalping is a risky trading strategy but if we can do it smartly, scalping could be very profitable compared to medium term strategy (IMHO). I am a divergence trader which open my position based on any spotted divergence. I only take few pips on every position. 10 - 20 pips is enough for me (a single trade). I can make 5 to 10 trades each day. Here I will show you how I trade EURJPY using M5 time frame, based on divergence.

Indicators:

  • Bollinger Bands (20,2)
  • CCI (14)
  • TF M15 or higher

Basic rules:

  • Price must create at least 2 significant high and must break upper or lower Bollinger Bands.
  • Divergence must be present before I go short or long. If there is no divergence, I won't open trade

cci scalping

Above you can see that price makes 2 lows, but CCI makes higher low. This condition is called as divergence. The, on the last low, you can see a green/bull candle with long tail. On the next candle after long tailed candle, we go long and as you can see price climbing up nicely. At least 10-20 pips can be gained easily. Our stop should be the last low of the candle.

Download forexfactory news indicator for MT4

Forex fundamental news plays important roles for every trader since medium or high impact news will drive the chart on one direction at a significant movement. Forexfactory.com is a popular website that provides any forex fundamental news you may check the website for any economic calendar. But, there is a simple indicator that will display any news right on your Metatrader 4 chart. It will display the upcoming news for the currencies. See my screenshot below how this indicator works

forexfactory indi

It’s a pretty cool indicator. Please note that when you change the pair, this indicator will also change the news corresponding with your pair so there is lag because MT4 have to download the news from forexfactory.com to update the news. Please let me know if the link is broken.

Download Forexfactory news indicator for MT4

DailyFX Economic Calendar indicator for FXCM free download

Fundamental news plays an important effects on Forex currencies movements. For technical analysis trader you may need to be aware for every high impact of any fundamental or economic news every day. Here I want to share the DailyFX Economic Calendar indicator for FXCM trading station. The fundamental data is provided by Dailyfx.com. Using DailyFX.com, traders can view all of the top economic news releases sorted by importance and currency pair. It is little surprise to note that the calendar is consistently one of our most popular pages.

dailyfx economic calendar indicator

This indicator will give you updates for every fundamental news right away on your trading station. You don’t have to open your browser to see the news. It’s a cool indicator. This indicator will integrate to your chart. Unfortunately this indicator only available for FXCM and its not available for Metatrader.

To download DailyFX Economic Calendar, please go to this download page.

How to trade CCI Divergence – Series 1

Currently Divergence is the most profitable system for me. CCI is the only oscillator indicator I have been using for last few years. Previously I use stochastic and oSMA and other oscillator but to me CCI is better than those two indicators to spot divergence. On this post I want to show you a profitable divergence that can give you a good profit for day trader or scalping. No more words, see this picture below.

divergence-cci-1

Trading rule (Long/Buy)

  • Price has made 2 significant lows and break lower Bollinger Bands (or in BB oversold area).
  • CCI shows divergence

I will not enter the trade if both conditions are not satisfied. For example price has made 2 lows but CCI does not show divergence. Buy position can be placed on the next candle after divergence and stop loss MUST be placed 5 pips or more below previous low. But I recommend you not to put your SL on your trade. Simply keep in mind if the price still goes down further and break the low, you should close your position. And stay away from the news. Do not enter the trade immediately after the news. Wait for few minutes and see if the news has made a clear direction to the market.

Thank you

Bollinger Bands and CCI Divergence trading system

On this tutorial, I am going to show you a nice setup using 2 indicators, Bollinger Bands (BB) and CCI. BB is a simple and nice indicator that can show us current trend but also can be used to spot a retracement or reversal. CCI is an oscillator indicator such as Stochastic that will be helpful if it shows divergence. I did not recommend to trade using CCI overbought and oversold state because price can go further even the CCI is at overbought or oversold area.

Indicators and settings:

  • Bollinger Bands (20 periods & 2 standard deviation)
  • CCI (14 periods)

Basic technique:

Take action when price break upper or lower BB and CCI shows divergence. Do not enter if both conditions do not meet. See my example below on pair EURJPY M15. Make sure that price has made at least 2 significant swing highs or lows.

divergence-cci

Enter Sell when:

There are at least 2 significant highs that breaks upper BB no matter if they are closed above or below BB upper.

On the example above, 1 and 2 create higher highs but the CCI does not show divergence. So we do not trade here because it does not meet our criteria. But then between 2 and 3 price makes new higher high but CCI shows lower high. On the next candle we can go short and the target is lower Bollinger Bands or simply put take profit as you want.

3 and 4 price makes higher high but the CCI also confirm it by creating higher high as well. But, if we compared 2 and 4, the CCI still shows divergence so we can go short here. We called this condition as 2nd divergence.

10 pips strategy on EURJPY based on divergence

By theory, divergence will make price to reverse or retrace. But, based on my experiences, the retracement on EURJPY pairs on every divergence still can give us more than 10 pips if we take the actions quicker. We do not have to wait the price to break the trendline. We only use upper or lower Bollinger Bands to help us to take buy or sell actions. See my example sell condition below.

div-eurjpy

OK. Lets analyze the picture above. Price makes new higher high but the oscillator do the opposite. This is divergence condition. As the confirmation, you can see the last pin bar candle is closed below or inside the upper Bollinger Bands. On the next candle we go short and take profit 10 pips. You can see that this divergence makes the reversal to the M15 time frame.

You can use another confirmation to the divergence such as candlestick pattern, support and resistant area, MA 60 periods bounce and many others. But, I will open my position when I spot a divergence, both hidden or normal divergence.

MACD Histogram hidden divergence trading

On this tutorial, I am going to show you how to trade divergence using MACD colored histogram indicator. MACD is a powerful Forex indicator that can tell you current trend and possibly trend reversal. On this tutorial, I am focus on hidden divergence which in theory this phenomenon will continue the current trend. If current trend is down and you spot hidden divergence then it will continue to down trend. See example below.

hidden-div-macd

Explanation:

On the picture above, price making lower high but the indicator (stochastic and MACD) showing the opposite. Those indicators make higher high. This condition is known as hidden divergence. As a result, the price continue to move down and makes new lower low. It’s a high probability setup since we go with the trend and its more safe.

How to trade trendline breakout-Short strategy

Trendline breakout is a simple and effective way to scalp the Forex market. It does not require a complex technical analysis. All we need to do is create a correct trendline connecting previous high or lows. When price is trending up, we connect low and higher low. 
See the picture below
On the picture above, price is trending up and we connect low and higher lows (yellow line). When price break the trendline, we go short and our target will be the lower bollinger band of the selected timeframe. This method will be more effective if we found a divergence on the upper Bollinger bands. The divergence will cause price to retrace or reverse and the trendline is our confirmation. 
Thank you.

FX Sniper CCI Indicator Download

FX Sniper CCI is a powerful Metatrader indicator when it used properly. Personally I like using FX Sniper as my trading arsenal to find the divergence between price and indicator and trade it. Here you may find the download link for the FX Sniper CCI indicator.

Here is the FX Sniper CCI screenshot

fxsniper-cci-indi

If you are interested, you can download this indicator from the link below

http://www.4shared.com/rar/-OzJxUQp/fx_sniper_t3_cci_indicator.htm

We do not responsible to any deleted files on the host server. We also do not responsible of any losses or profit you may encounter during trading the forex.

Download Top Dog Trading Course Video

Top Dog Trading system is a popular trading system and strategy. Many of us (including me) was struggling to find the free video course of Top Dog Trading. After searching on many forums and website, finally I found them and want to share here.

top dog trading

Please use the following links to download Top Dog Trading video courses:

http://www.4shared.com/video/RfvKjlyv/topdog_course1_video1.html
http://www.4shared.com/video/IaWr4Hdb/topdog_course1_video2.html
http://www.4shared.com/video/zctVO6kn/topdog_course1_video3.html
http://www.4shared.com/video/i2OQfSzK/topdog_course1_video4.html

Based on original Visionary template by Justin Tadlock
Visionary Reloaded theme by Blogger Templates
This template is brought to you by Blogger templates

Visionary WordPress Theme by Justin Tadlock Powered by Blogger, state-of-the-art semantic personal publishing platform