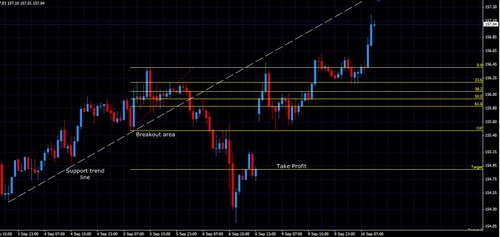
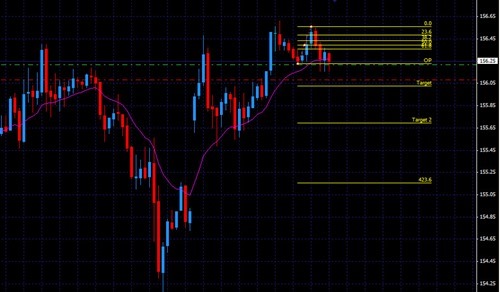
Almost Perfect Fibonacci breakout strategy

I’ve been testing this kind of trading strategy for about 3 months in both real and demo account. The main problem of this strategy is to believe this strategy itself. With fibonacci, if all conditions are satisfied, 99% the target will be reach. This strategy works on any time frame but its recommended to use H1 or H4 only since these TF have less fakeout and why I am not recommend to use D1 or higher since its too long to wait for the trade setup and target to be reached.

The main conditions must be met are:

  1. Price has made higher high on SELL signal and lower low for BUY signal. This Fibonacci breakout is a reversal strategy. So actually we buy at a low price and SELL at high price.
  2. Do not use stop loss. Just use your lot management based on your account balance. Its recommend to have 1000 or 2000 USD for 1 mini lot per trade. So if you only have 100 USD on your account, you should use 0.1 mini lot on each trade.
  3. Price must break out breakout line which is 100 fibo level. Do not open any trade if the price does not break this line.

Ideal BUY position

First, find and identify the most recent lower low. Make sure price has made a significant lower low. Then, when price move up and break the most recent high, it will reach the Fibo level 161.8. See my illustration below

fibo breakout 1


Just got 10 pips on EURJPY 26 September 2013

I just opened buy trade on EURJPY this morning and alhamdulillah I got 10 pips in just few minutes. This is a fibonacci breakout strategy which gives me a lot of pips so far. Here is the trade screenshot.

buy-eurjpy-fibo


Fibonacci breakout trade AUDUSD 13 September 2013

Fibonacci breakout still my favorite system right now. On this post I want to show you how this system works pretty well on AUDUSD 13 September 2013 on M15 time frame. In order to open BUY position, I have to wait the price made a fresh lower low. If this condition does not met, I do not enter the trade. See the setup below

fibo breakout


Trade signal SELL EURJPY on 11 September 2013

Here is my trade signal for today 11 September 2013. I was waiting for Short position on EURJPY or USDJPY. Here is my trade setup

eurjpy-sell

Position details:

  • Direction: Short/SELL
  • Pair: EURJPY
  • Price: 132.96
  • Take Profit: 132.63
  • Size: 1 lot
  • SL: No SL

We’ll see in the next few hours

Trendline breakout with Fibonacci

This post will show you how to trade using trendline breakout method and Fibonacci level as the target or take profit area. On this example I am going to show you how this system works for you. No indicator needed. We only watch for the significant swing highs and swing lows.

trendline-fibonacci


Short GBPJPY 8 September 2013

I just open short position on GBPJPY pair on 8 September 2013. This trade is based on Fibonacci breakout system. I only look for about 15 pips as my target but I use 5 mini lots. I hope this will be a good trade for today.

gbpjpy-8-sept-2013


Buy EURJPY on Monday 02 September 2013

This is a free Forex signal from my self and I hope this will profitable and hit my profit target. EURJPY has broken my resistant area and now moving upward. The target will be the 161.8 level of the Fibonacci retracement. I called this strategy as Fibonacci breakout trading system. Here is the setup:

fibo breakout

The price has move up and break the 100 level of Fibonacci. I open Long and put the target on 161.8 level. This could be a semi long trading since I am sure that my take profit will not hit in the next few hours.

Lets wait and see.

Price action trading with Donchian Bands

Personally,I am still have no confidence to trade price action only. I still need a dynamic support and resistant indicator to improve my confidence when entering the trade. One of the good tool that I found is the Donchian Bands or Donchian Channel. I use Donchian Bands as the bounce area when price hit the upper or lower bands and there is a price action signal around the area.

After backtesting and looking for the good signal, the following trade conditions are good area to open the trade

BUY Position

  • Candle must hit or move around lower Donchian Bands
  • Candle must be closed and have a long wick—pin bar candle is more powerful
  • Open position when price move up and break the long wick candle
  • I use fibonacci 161 level for my target
  • Stop loss must be placed on the recent low on the lower Donchian Bands

Illustration

pin bar donchian


Pin bar trading EURJPY 17 July 2013

In term of learning Forex, I use Trade Sim expert advisor to improve my sense of detecting candle stick pattern trading. Here I want to show you how the pin bar candle works perfectly. I use EURJPY on 17 July 2013 as the base. See the chart below for better visualization.

pinbar


Based on original Visionary template by Justin Tadlock
Visionary Reloaded theme by Blogger Templates
This template is brought to you by Blogger templates

Visionary WordPress Theme by Justin Tadlock Powered by Blogger, state-of-the-art semantic personal publishing platform