2 bar breakout strategy on GBPUSD September 11, 2014
Labels: 2 bar breakout
Super Signal breakout trading strategy
Labels: Fibonacci Breakout
SELL GBPCHF based on Fibonacci and Super Signal
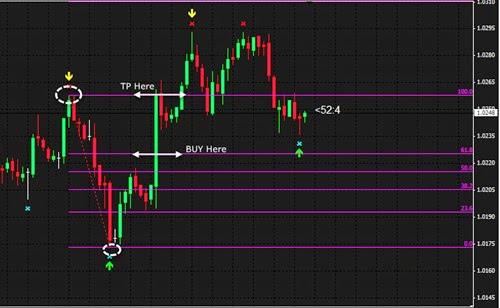
Here is another example how this Fibonacci and Super Signal trading strategy works. I want to show you how I open SELL GBPCHF on 8 April 2014 using this technique. I use H1 time frame since this timeframe is not too long to wait and its a reliable one to get minimum 10 pips per trade.
See the chart above, I draw my fibonacci retracement tool from the green arrow to the yellow arrow (circle marked). The idea is when the price move down and break level 61.8 it will continue to level 100 or even more. As you see, I got 30 pips on that trade. It takes few hours before the target was hit.
Labels: Fibonacci Breakout
Fibonacci and Super Signal trading strategy
I want to introduce a simple and profitable trading strategy which utilize Fibonacci and Super Signal indicator. This Fibonacci and Super Signal Trading Strategy already give me nice result for the last few trading days
The idea of this trading system is to follow the current trend. If the trend is up, we wait for a pullback before we open a BUY position. Here is the example of this Fibonacci and Super Signal trading strategy
Labels: Fibonacci Breakout
Trade result SELL EURJPY 4 April 2014
In few hours, my 10 pips target SELL EURJPY on 4 April 2014 hit the target. I got 10 pips. This trade was taken based on MACD and Stochastic indicator. Please read my previous post about this trade strategy.
Here is the previous post trading signal generated by MACD and Stochastic
In few hours, this is the chart of EURJPY
Labels: Trading Result
Testing to get 10 pips EURJPY 4 April 2014
Today is 4 April 2014 and I was opening SELL trade on EURJPY just trying to get 10 pips (13 pips including spread). This trade was taken based on the difference of MACD and Stochastic oscillator. MACD trend is down but the Stochastic is crossing above the MACD. So I hope it will continue to move down and 10 pips should be reached.
As you see the current H1 chart MACD show a down trend (MACD lines are below the zero level). But the Stochastic is travelling above the MACD zero line. Most of time, this condition indicate that the price will continue to move further down. But let see in few hours.
Cheers
Labels: MACD
Super Signal Fix Distance breakout trading strategy
Super Signal Fix Distance V3 is a good BUY and SELL signal indicator. But like many other indicators, fake signals occur every time. Even there is a SELL signal, its not necessarily to open SELL immediately. We must have another strategy or indicator to confirm that the price will move down. Here I want to show you how to use this Super Signal Fix Distance indicator with Fibonacci breakout strategy.
This strategy sometimes hit the profit target in just few minutes but sometimes it can take few days. But my believe is that the level 161.8 is very important, so no matter how long it will take, the profit target will be reached, as long as the conditions are met.
Labels: Fibonacci Breakout
Trade result SELL GBPJPY 24 March 2014
In just one hour my profit target was hit. This is the trade result of my previous signal SELL GBPJPY on 24 March 2014 based on breakout strategy.
Labels: Trading Result
SELL GBPJPY 24 March 2014
I just opened a SELL position on GBPJPY pair this evening. Today is Monday 24th March 2014. Based on my breakout signal, GBPJPY should travelling to around 168.38. Here is my trade setup
The price has broken the last support and I took sell position with the target is Fibonacci level 161.8. I hope this will be a good trade for me.
Labels: Trade signal
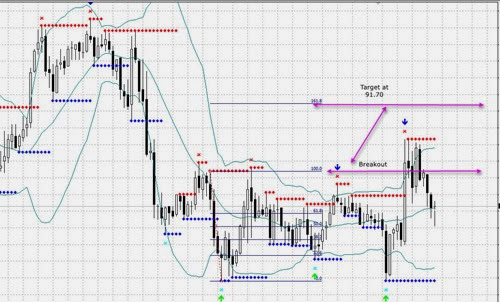
CADJPY buy target 91.70
It still a good chance to buy CADJPY and the target at 91.70. This trade signal is based on the SuperSignal and Support Resistant breakout. The price has triggered the BUY area but still not hit the target yet. Here is the trade setup.
Will see this trade setup on the next trading days. Cheers
Labels: Trade signal
Based on original Visionary template by Justin Tadlock
Visionary Reloaded theme by Blogger Templates
This template is brought to you by Blogger templates


