Showing posts with label Naked Trading. Show all posts

Candlestick formation with high winning probability

There are many price action or candle stick formation that really works.One of my favorite is the following. On a sell or down trend, a long bullish candle formed and then followed by a big bearish candle stick with almost the same size as the bullish one. 

Price action trading - Long body candle reversal

Salah satu sinyal buy/sell berdasarkan price action yang cukup berhasil adalah dengan memanfaatkan long body candle reversal (istilah saya sendiri, gak tau istilah keren nya apa hehe...). Ciri dari sinyal Long body candle reversal ini adalah apabila ada satu candle panjang misalnya bullish kemudian candle berikutnya adalah candle bearish dengan panjang melebihi/menembus candle bullish tersebut maka kita bisa ambil posisi sell dan target profit sebesar panjang dari candle bullish tersebut. Berikut illustrasinya

Successful Candlestick formation #1

Hi, its been a while since the last post. I am a bit busy with another kind of job so I cannot post more about my trading experiences. Here, I want to add my trading arsenal with the price action strategy. As always, I do not believe in most fancy indicators. Price actions is the one and only strategy which gives me more profits each days. Here I want to show you a nice price action setup which you may read already on another blogs or someone else's website. 

I do not know the name of this candlestick formation. Name is not too important for me :) 
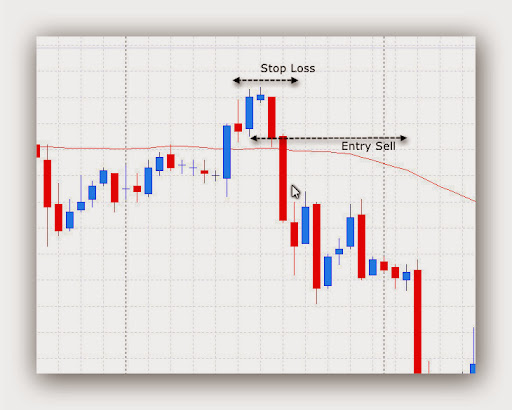
OK, I'll try to explain the chart above. 

See the tiny candle on the peak of the chart. after a quite long bullish candle then the next candle is very tiny/small with short tail on each side. This candle formation will be a good short setup only when it breaks the previous longer bullish candle. See the entry line above. I open sell only when it break the longer bullish candle not the small candle. Stop Loss always put few pips above the highest point on the candle formation. 

Kondisi ideal untuk Sell dengan metode fibonacci breakout

Pada posting berikut akan saya coba jelaskan salah satu kondisi ideal untuk posisi SELL dengan metode Fibonacci breakout yang cukup sukses saya gunakan beberapa waktu terakhir. Syarat utama untuk open posisi SELL adalah candle membentuk higher high. Lihat gambar berikut:

Fibonacci breakout still the best trade system so far

I do love this system which called Fibonacci breakout system. The basic of this system is to catch the breakout on 100 fibonacci level and the target is 161.8 fibonacci level. Fibonacci breakout system works on any pairs and best on M15 or higher timeframe. But I do not recommend to use this system on D1 or weekly time frame since it will take longer and need more balance to hold the floating. 
See the example on EURUSD H4 below
In order to open BUY, price have to make lower high. If this condition does not meet, we do not open buy. See the picture above where EURUSD has made lower high. The idea is to open the BUY position once price break the last lower high. Sometimes price directly move up without any retest, but sometime price still made retest. 

Almost Perfect Fibonacci breakout strategy

I’ve been testing this kind of trading strategy for about 3 months in both real and demo account. The main problem of this strategy is to believe this strategy itself. With fibonacci, if all conditions are satisfied, 99% the target will be reach. This strategy works on any time frame but its recommended to use H1 or H4 only since these TF have less fakeout and why I am not recommend to use D1 or higher since its too long to wait for the trade setup and target to be reached.

The main conditions must be met are:

  1. Price has made higher high on SELL signal and lower low for BUY signal. This Fibonacci breakout is a reversal strategy. So actually we buy at a low price and SELL at high price.
  2. Do not use stop loss. Just use your lot management based on your account balance. Its recommend to have 1000 or 2000 USD for 1 mini lot per trade. So if you only have 100 USD on your account, you should use 0.1 mini lot on each trade.
  3. Price must break out breakout line which is 100 fibo level. Do not open any trade if the price does not break this line.

Ideal BUY position

First, find and identify the most recent lower low. Make sure price has made a significant lower low. Then, when price move up and break the most recent high, it will reach the Fibo level 161.8. See my illustration below

fibo breakout 1


Fibonacci breakout trade AUDUSD 13 September 2013

Fibonacci breakout still my favorite system right now. On this post I want to show you how this system works pretty well on AUDUSD 13 September 2013 on M15 time frame. In order to open BUY position, I have to wait the price made a fresh lower low. If this condition does not met, I do not enter the trade. See the setup below

fibo breakout


Trendline breakout with Fibonacci

This post will show you how to trade using trendline breakout method and Fibonacci level as the target or take profit area. On this example I am going to show you how this system works for you. No indicator needed. We only watch for the significant swing highs and swing lows.

trendline-fibonacci


Price action trading with Donchian Bands

Personally,I am still have no confidence to trade price action only. I still need a dynamic support and resistant indicator to improve my confidence when entering the trade. One of the good tool that I found is the Donchian Bands or Donchian Channel. I use Donchian Bands as the bounce area when price hit the upper or lower bands and there is a price action signal around the area.

After backtesting and looking for the good signal, the following trade conditions are good area to open the trade

BUY Position

  • Candle must hit or move around lower Donchian Bands
  • Candle must be closed and have a long wick—pin bar candle is more powerful
  • Open position when price move up and break the long wick candle
  • I use fibonacci 161 level for my target
  • Stop loss must be placed on the recent low on the lower Donchian Bands

Illustration

pin bar donchian


Pin bar trading EURJPY 17 July 2013

In term of learning Forex, I use Trade Sim expert advisor to improve my sense of detecting candle stick pattern trading. Here I want to show you how the pin bar candle works perfectly. I use EURJPY on 17 July 2013 as the base. See the chart below for better visualization.

pinbar


Failed long wick signal

On my previous post, I’ve shown a successful long wick trading signal. Here I am going to show you how the long wick signal can be failed as well as any other signal. Since there is no such a perfect system, stop loss always the savior for every trading setup.

failed long wick


Price action trading using long wick candle signal

I like to trade based on price action with no indicator attached on my chart. I don’t like any indicators on my chart because it makes me confuse sometimes. Now, I am learning to trade based on price action only. And the most price action signal that I love is the long wick/tail candle.

How to trade this long tailed candle?

long wick


Simple price action trading strategy-pin bar candlestick

In last couple days I searched for any new profitable Forex method without any indicator. I started with Fibonacci breakout and it works pretty well. Now, I am trying to combine the Fibonacci breakout and some other price action strategy. Price action is a good way to trade Forex currencies because if we rely on indicators, we will missed the momentum.

On this post, I am going to show some nice setup using pin bar candlestick or hammer type candlestick. I do not trade based on this pin bar only but, if we spot a pin bar candle, we can prepare ourselves to enter the trade as well.

Based on original Visionary template by Justin Tadlock
Visionary Reloaded theme by Blogger Templates
This template is brought to you by Blogger templates

Visionary WordPress Theme by Justin Tadlock Powered by Blogger, state-of-the-art semantic personal publishing platform